Gallery
Screenshots of the reporting dashboard, simulation results, and the prompts and responses used to choose simulation parameters. Select an image to view it at full size.
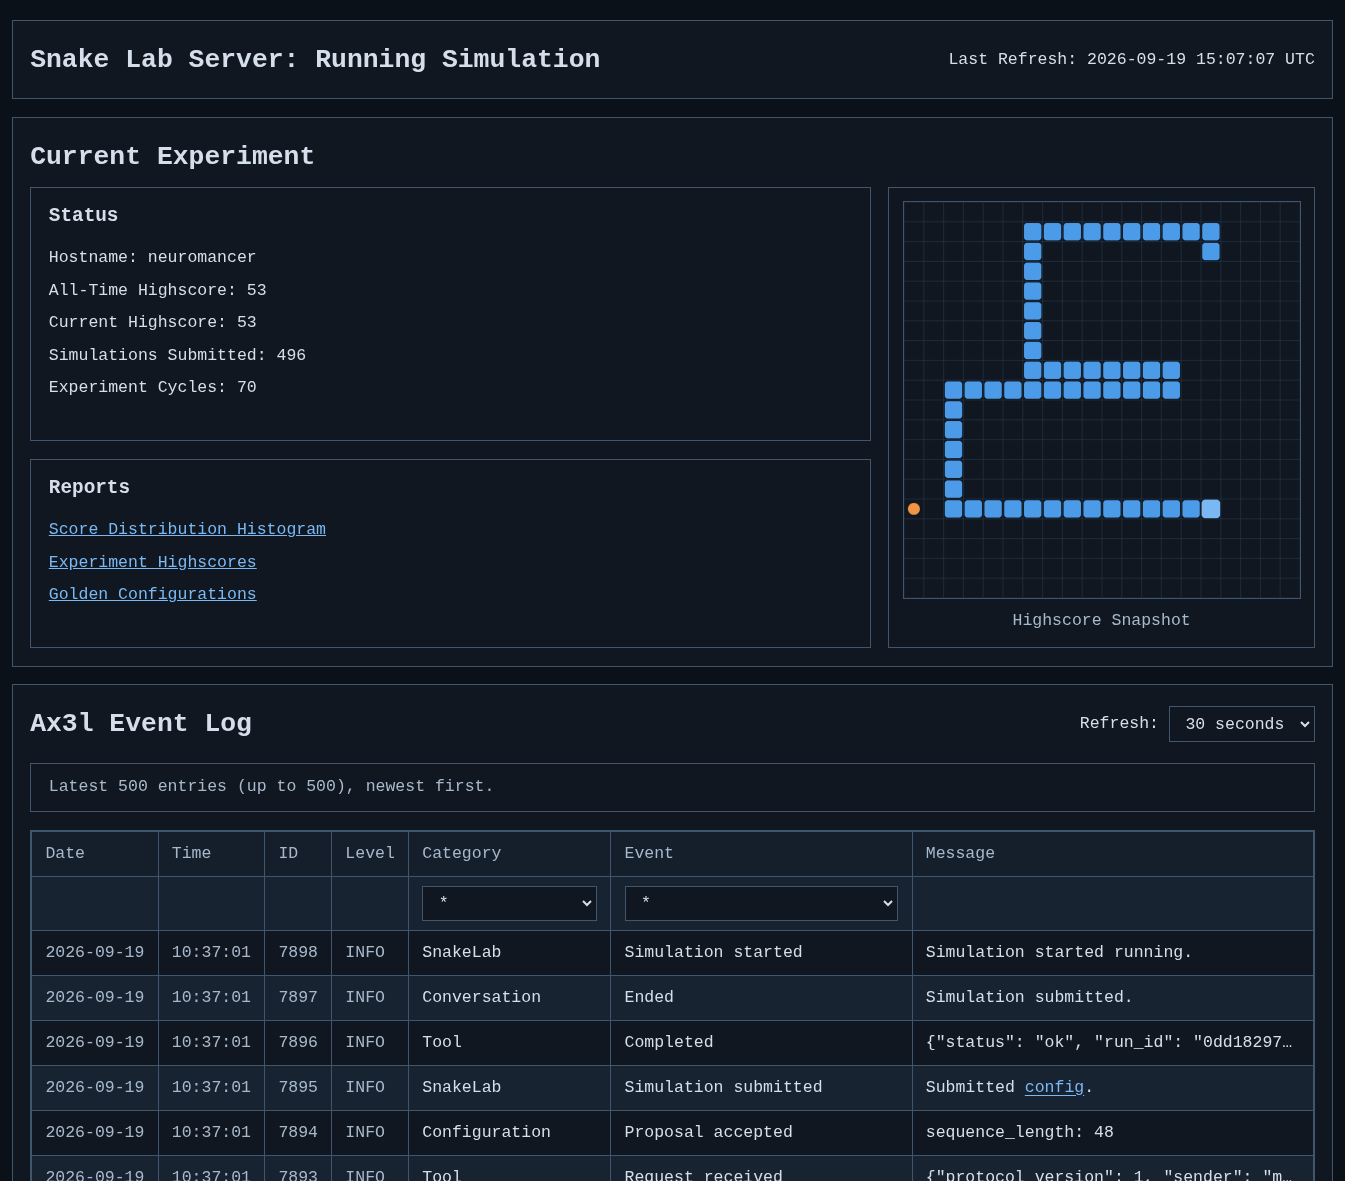
Reporting dashboard
The current experiment, high-score board, report links, and event log.
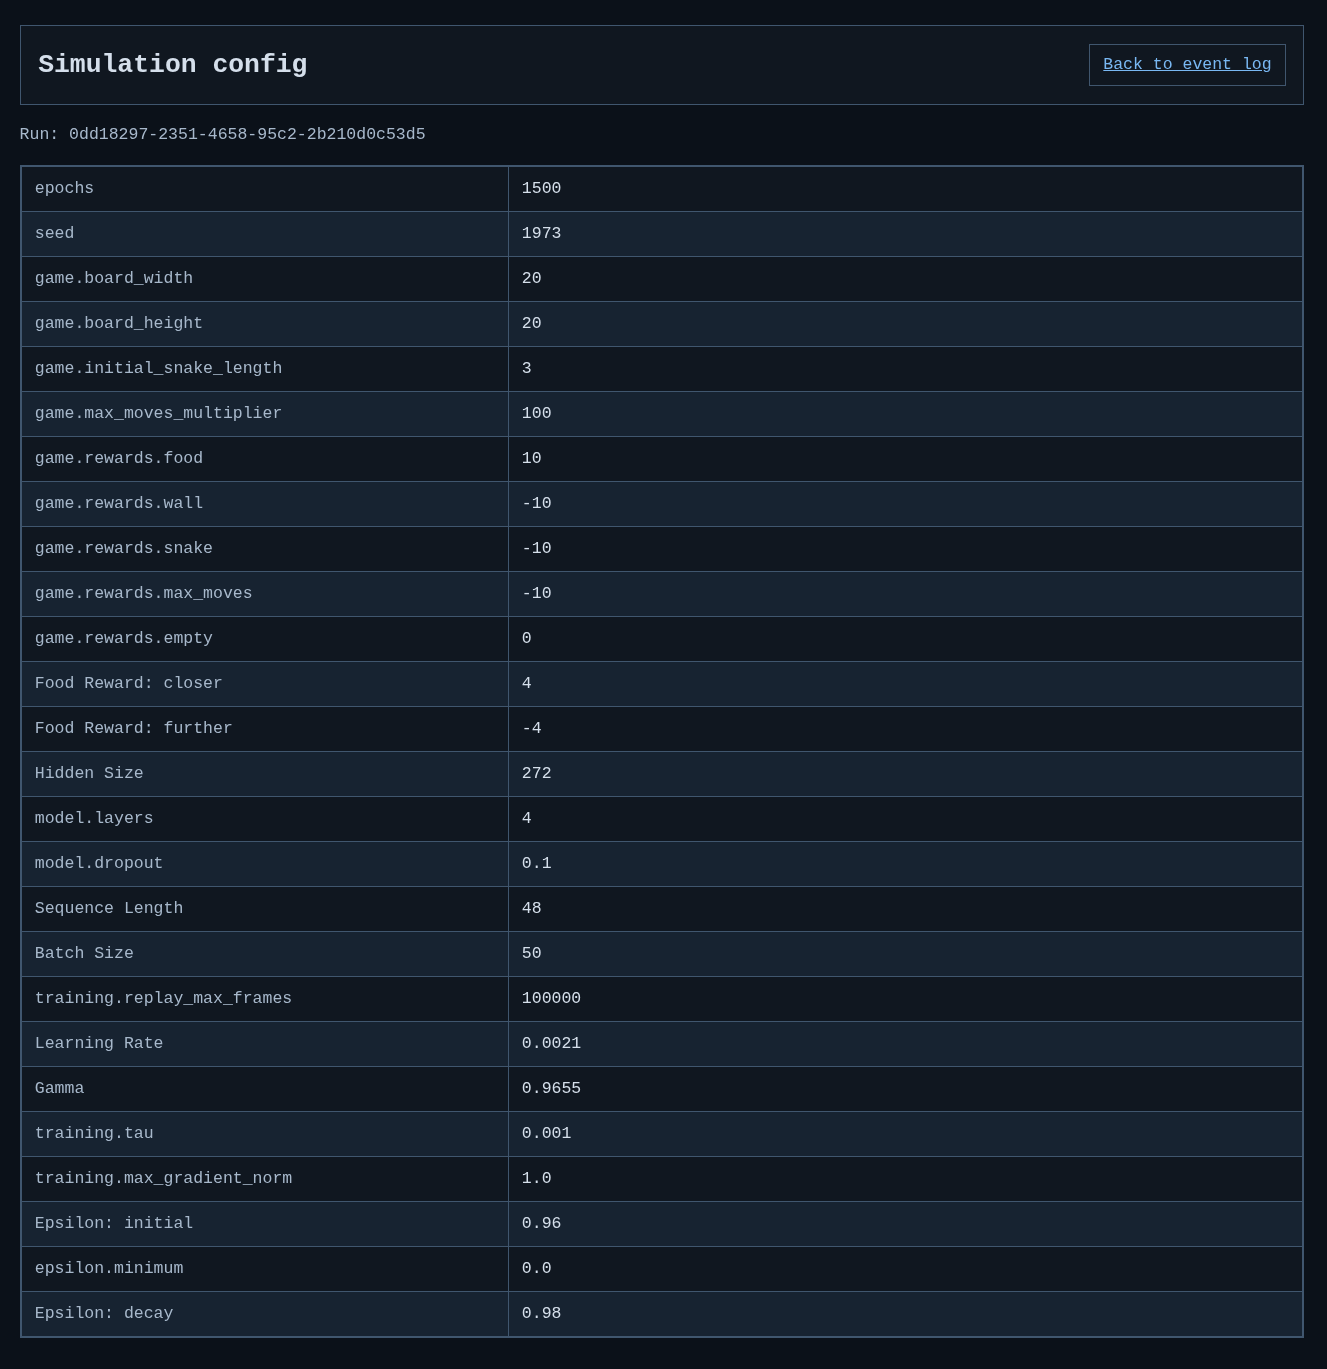
Simulation configuration
The game, model, and training settings used for a simulation run.
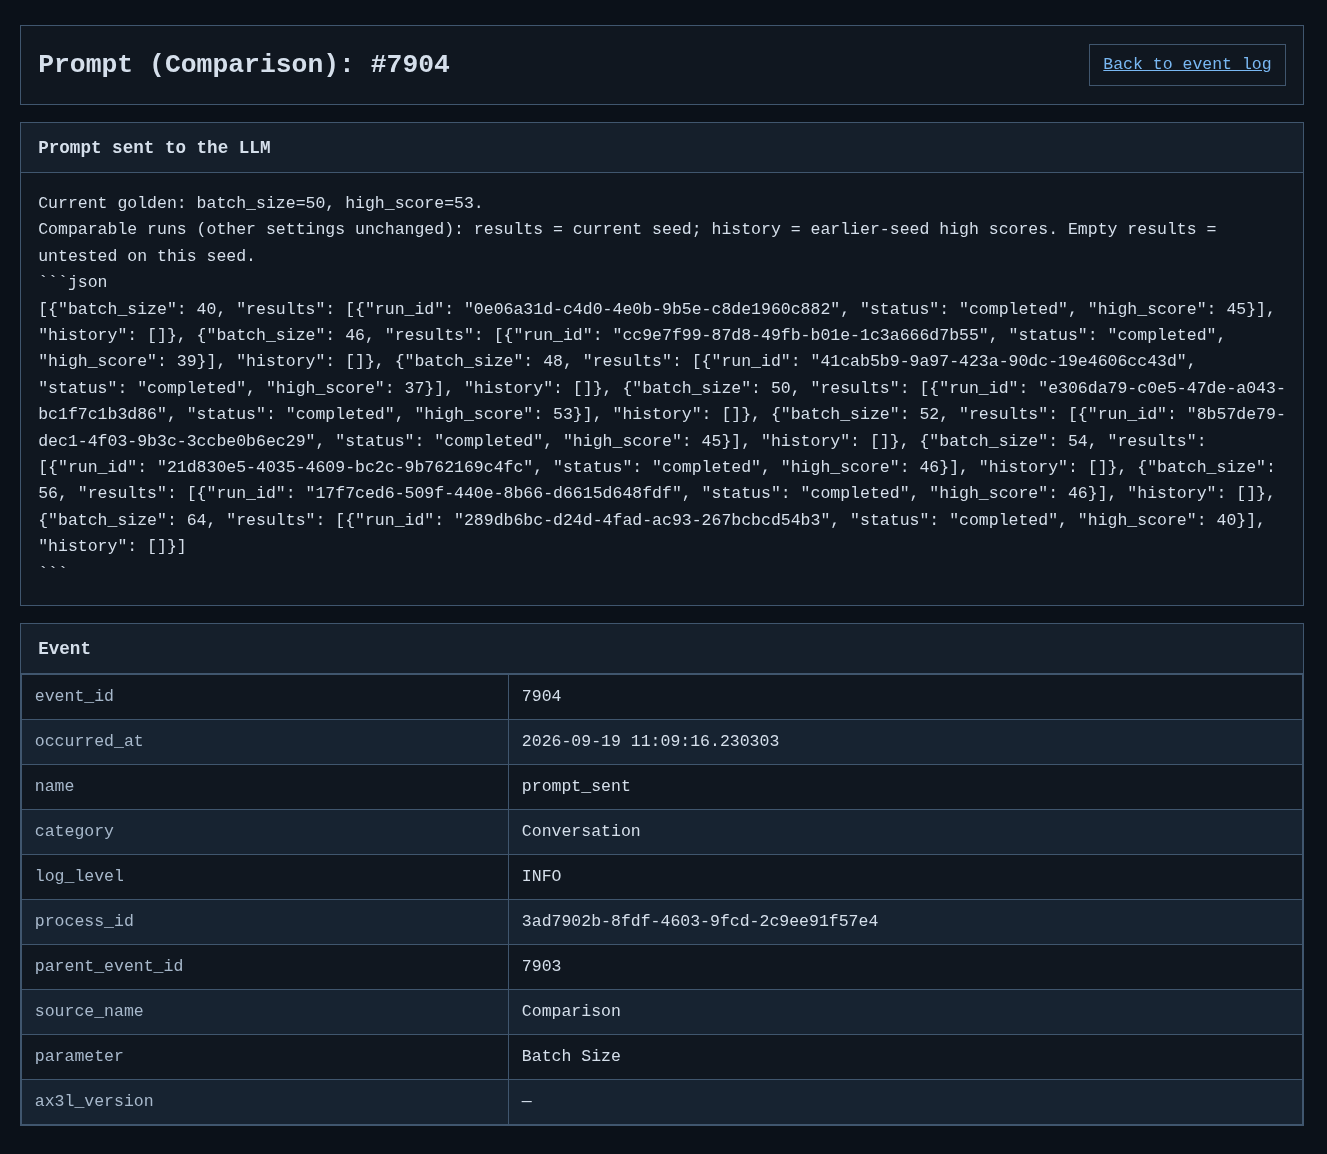
Parameter history prompt
The current golden configuration and comparable results supplied to the LLM before it selects a new parameter value.
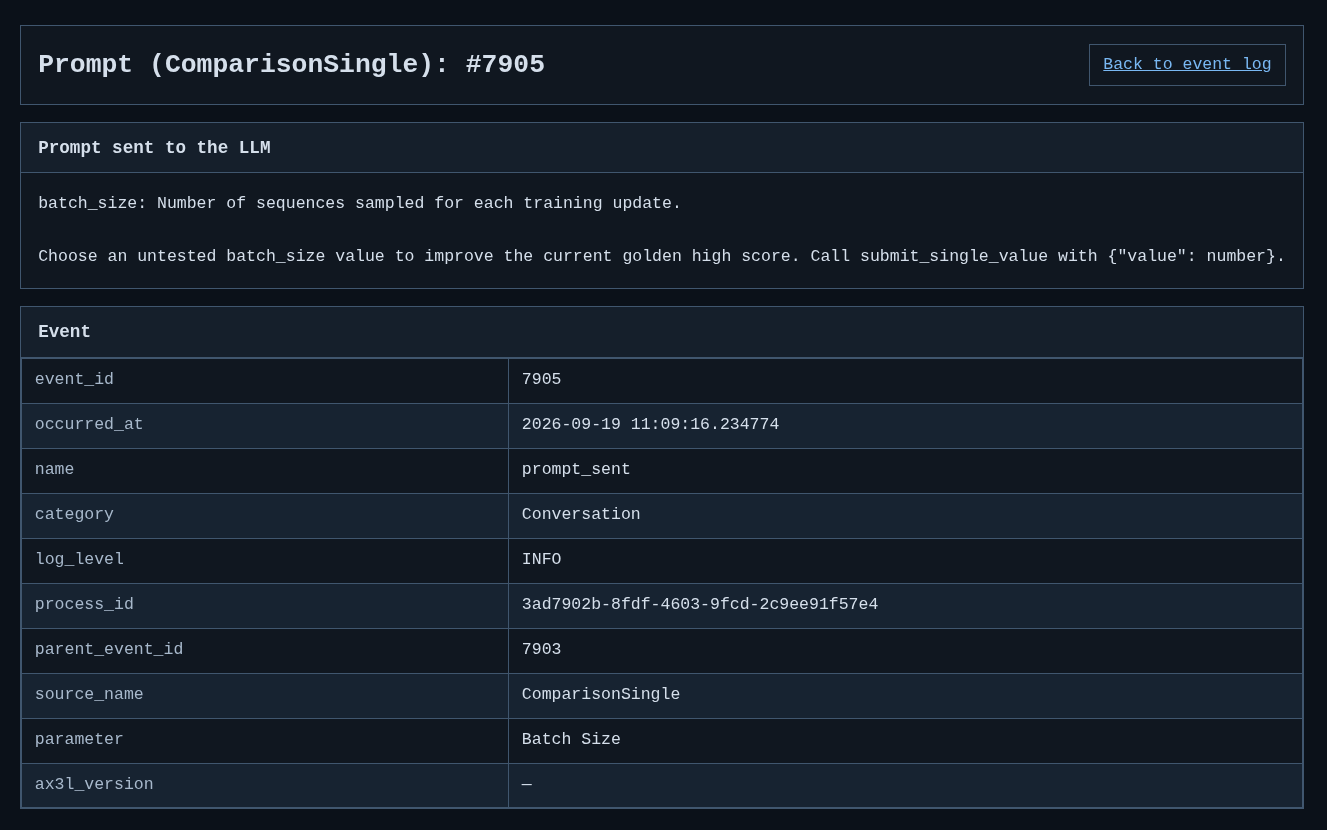
Parameter selection prompt
The instruction to choose an untested batch size and submit it through a tool call.
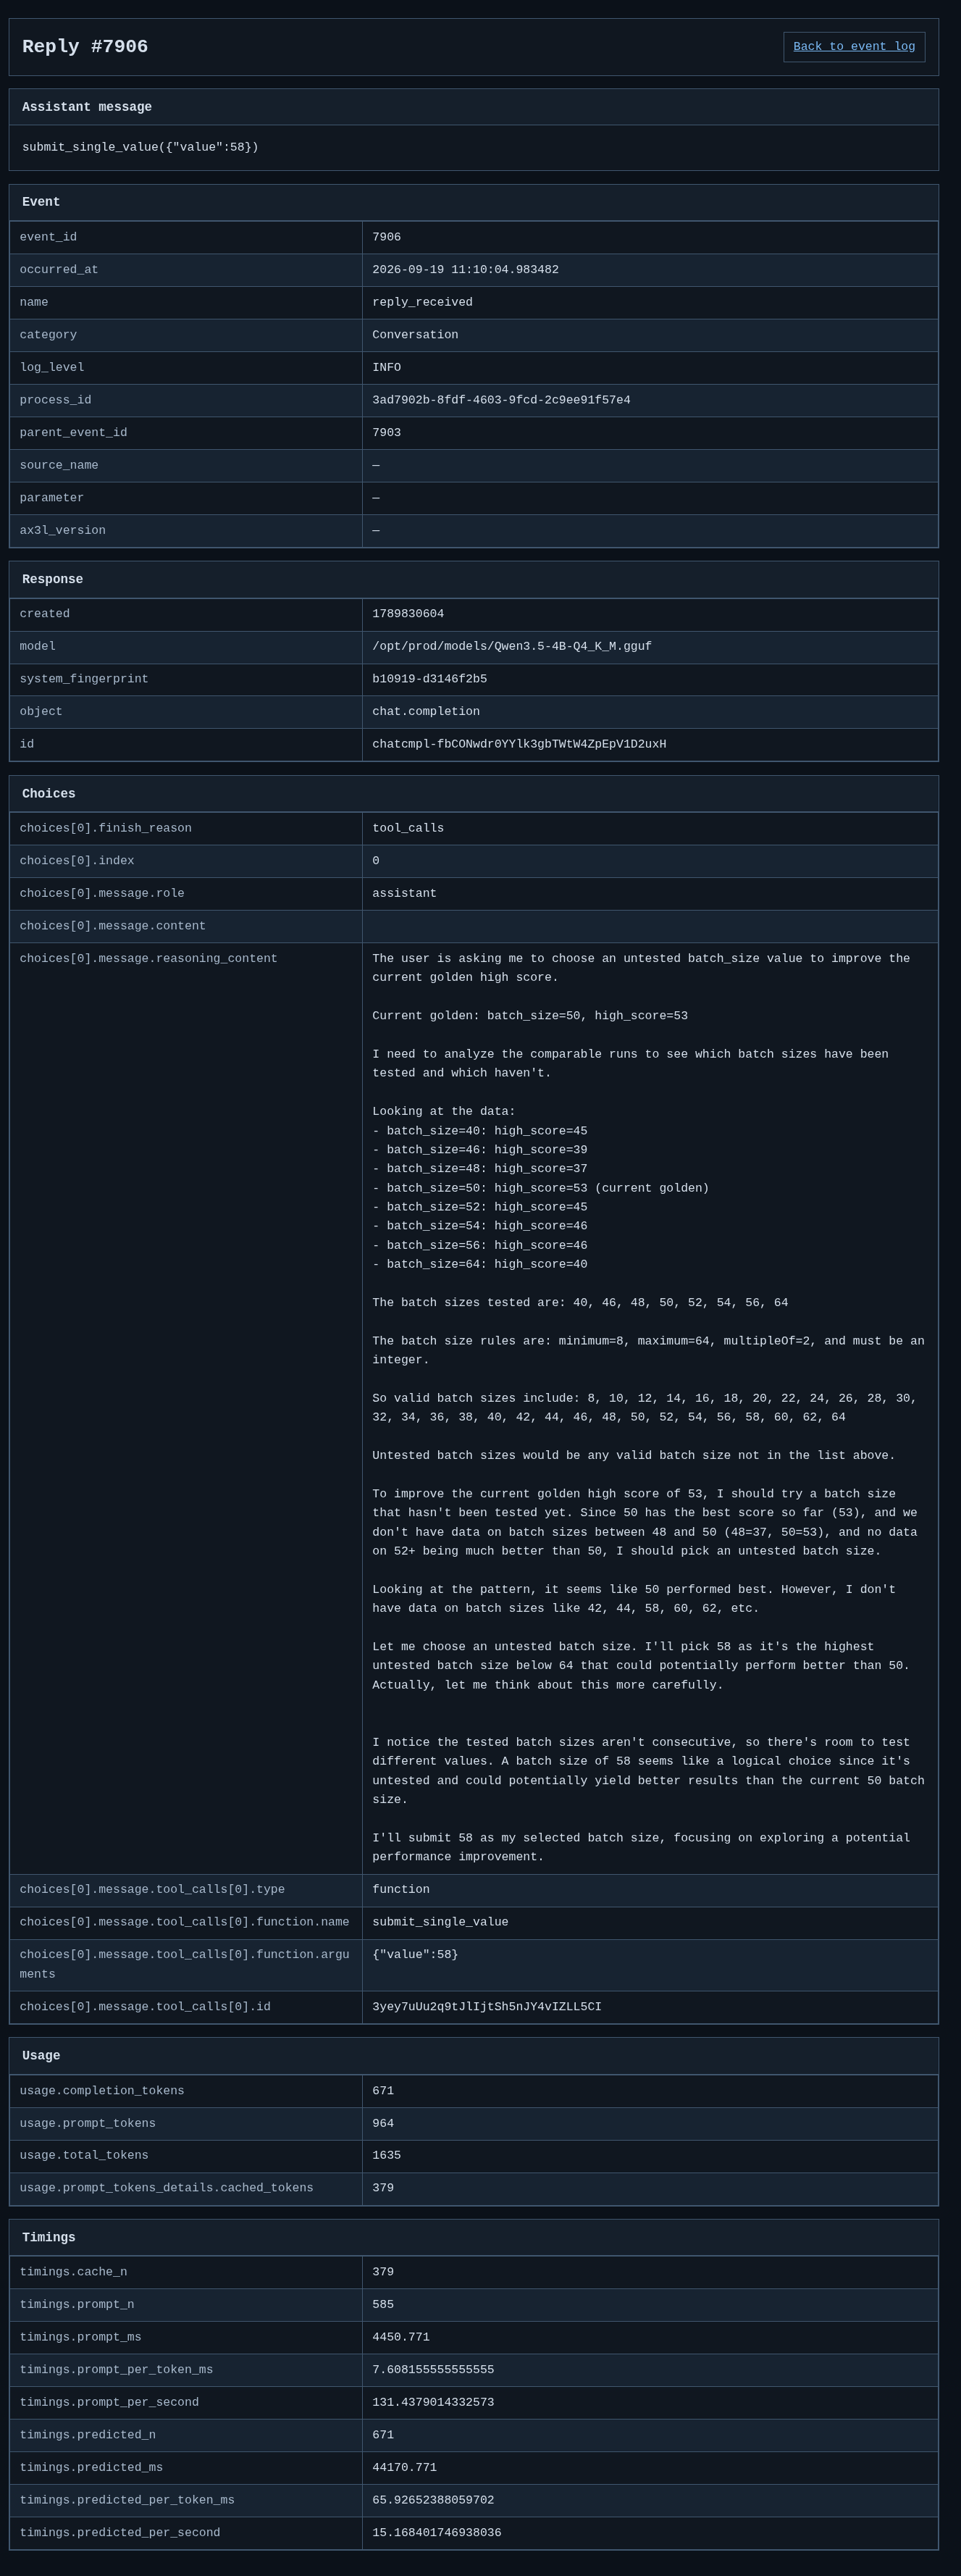
LLM response
The recorded reply, including the selected value, reasoning, tool call, token usage, and timings.
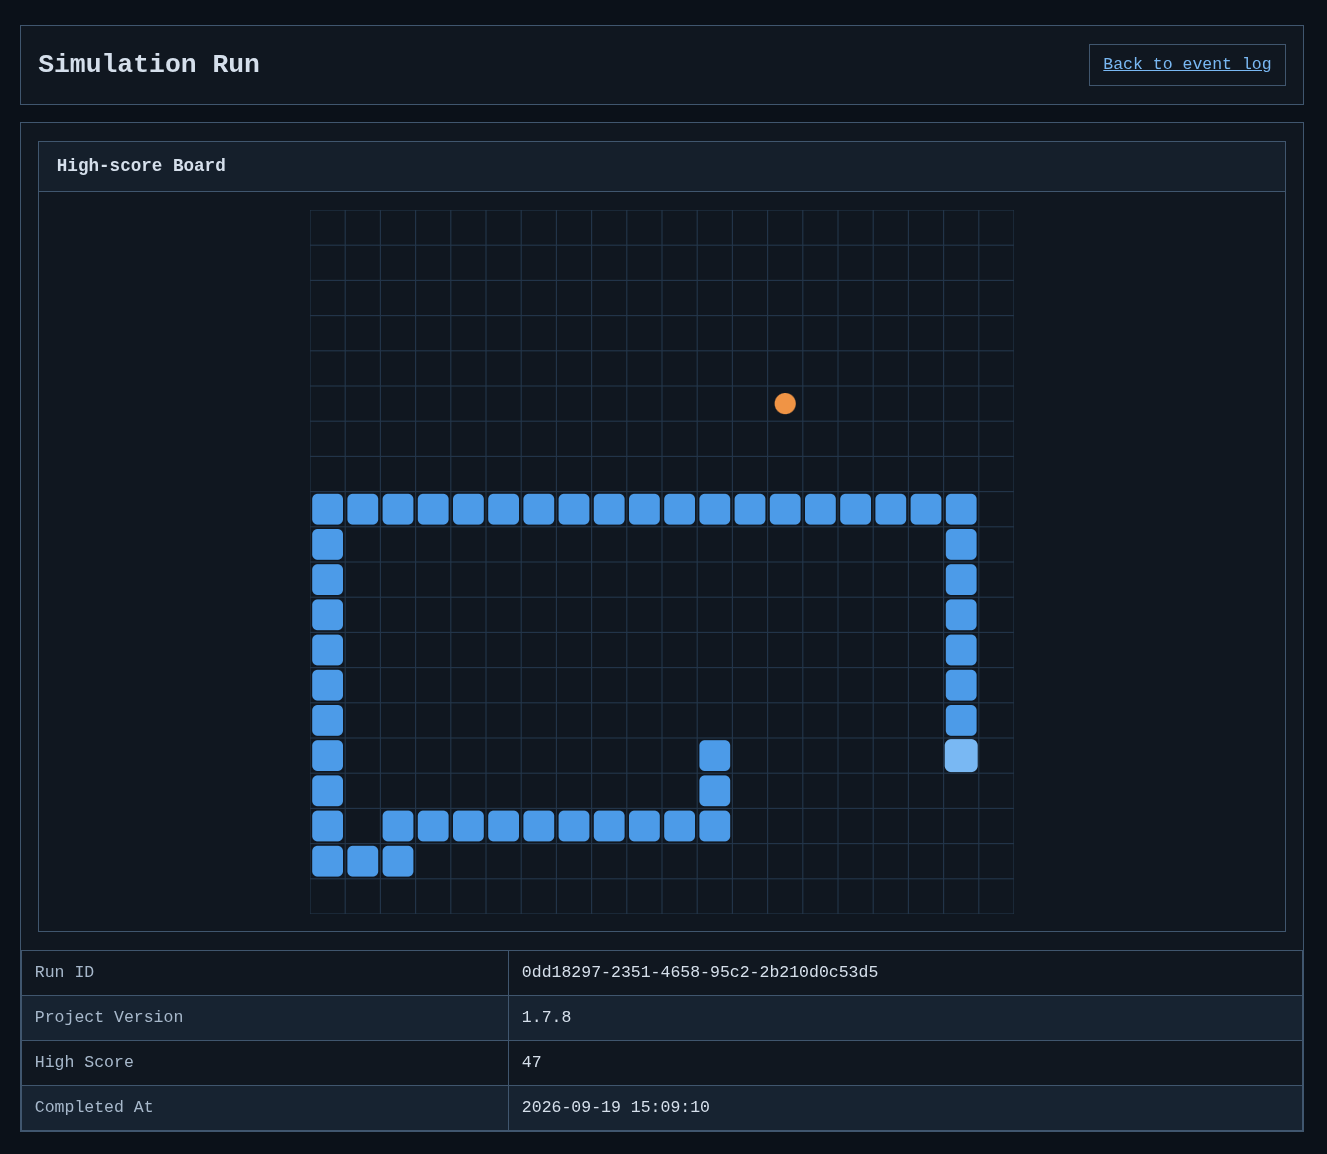
Completed simulation
A completed run’s high-score board, run identifier, project version, score, and completion time.
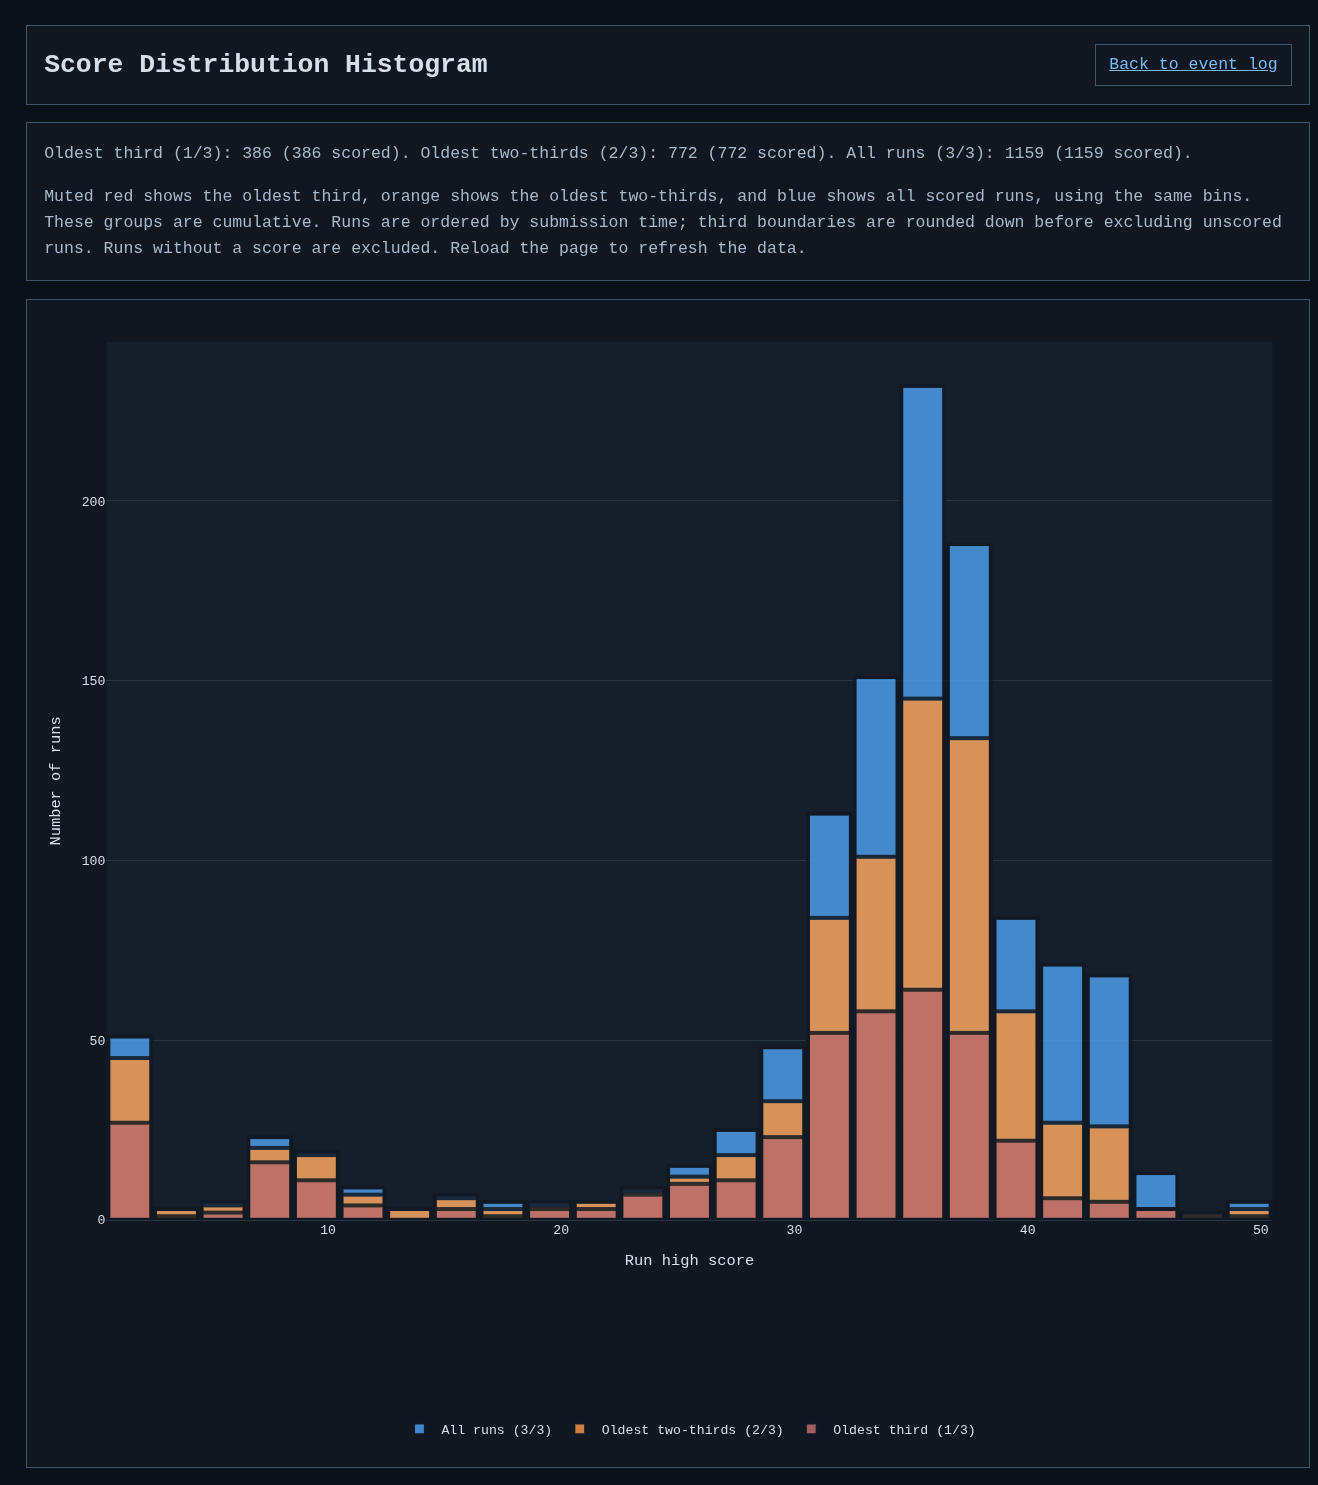
Score distribution
Run high scores across the experiment, comparing all scored runs with the oldest half.
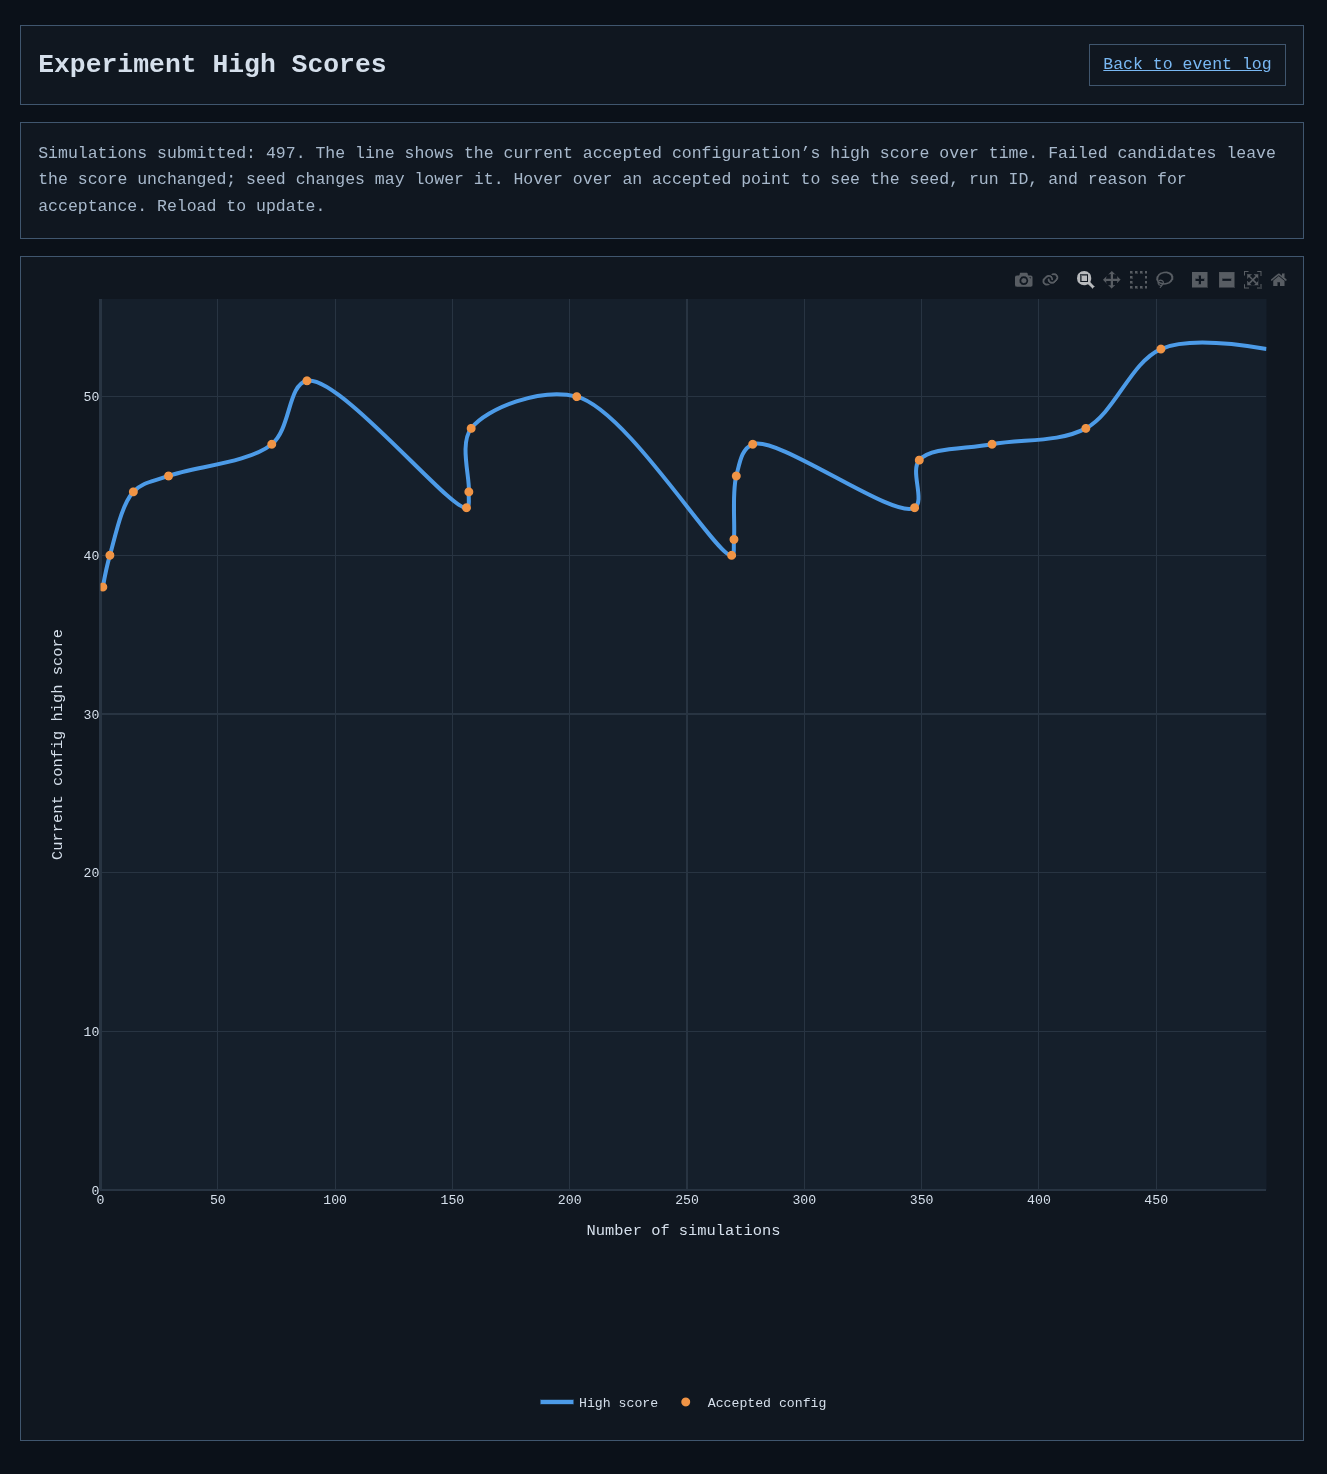
Experiment high scores
The accepted configuration’s high score over the course of the experiment, including changes after seed rotation.
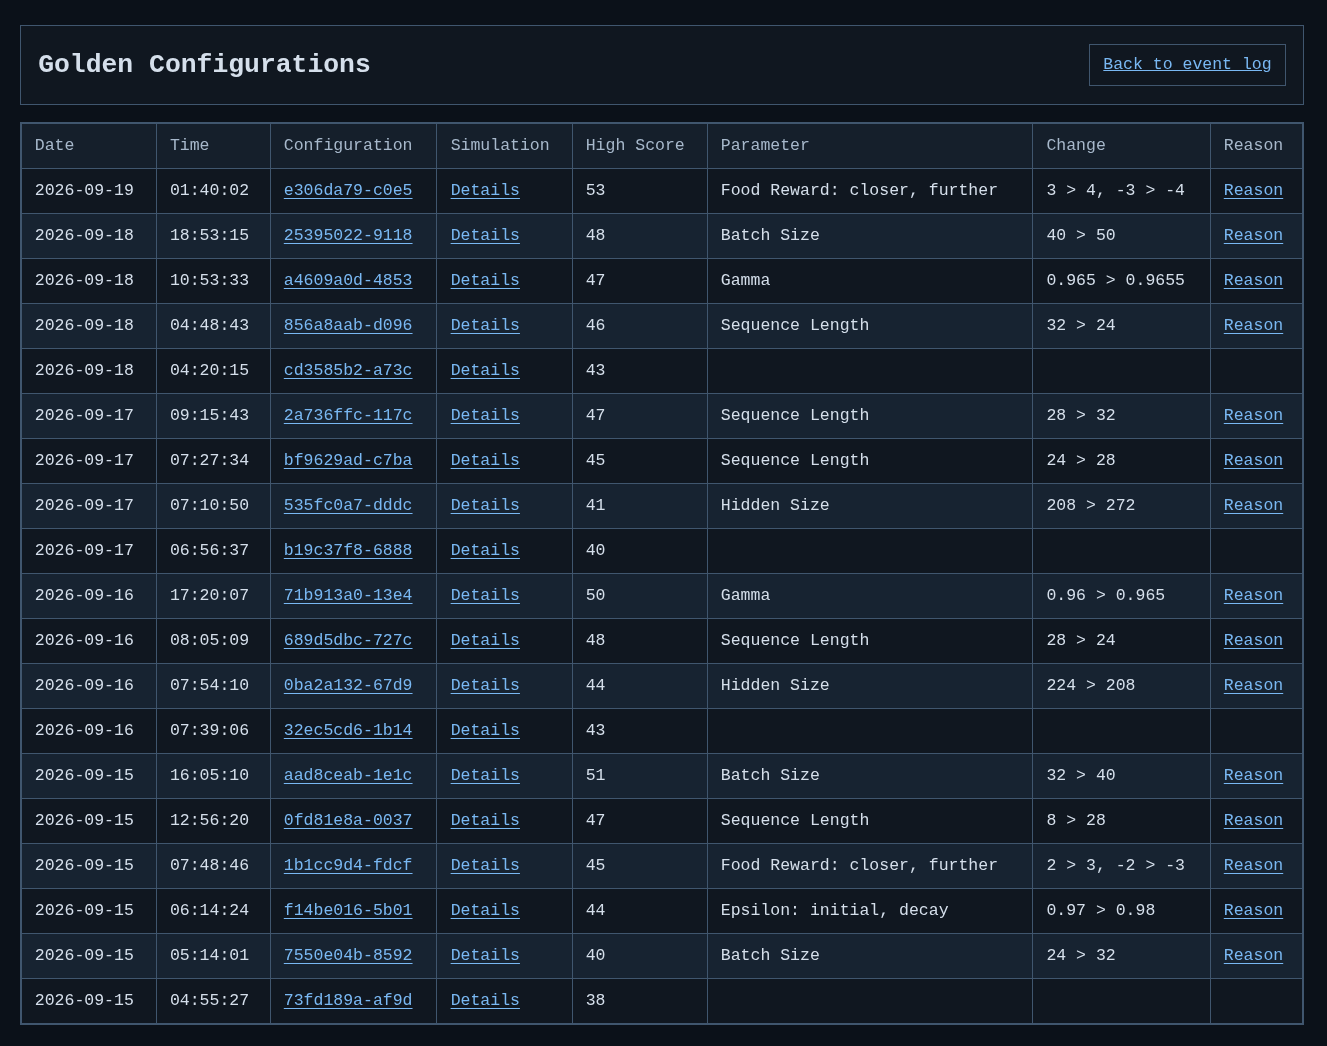
Golden configurations
Accepted configurations with their scores, parameter changes, and links to the reasons for acceptance.